Connect with us

Hi, what are you looking for?

Stock

S&P 500 Selloff: Bearish Rotation & Key Downside Targets!

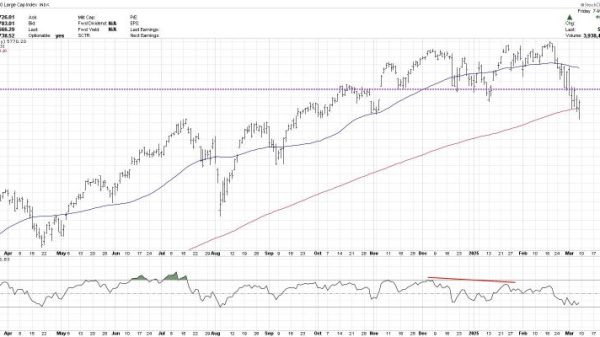
In this video, Dave analyzes market conditions, bearish divergences, and leadership rotation in recent weeks. He examines the S&P 500 daily chart, highlighting how this week’s selloff may confirm a bearish rotation and set downside price targets using moving averages and Fibonacci retracements. To validate a potential end to the bearish phase, he shares a key technical analysis chart. What’s your S&P 500 downside objective?

This video originally premiered on March 4, 2025. Watch on StockCharts’ dedicated David Keller page!

Previously recorded videos from Dave are available at this link.

    Join our mailing list to get access to special deals, promotions, and insider information. Your exclusive benefits await! Enjoy personalized recommendations, first dibs on sales, and members-only content that makes you feel like a true VIP. Sign up now and start saving!


    By opting in you agree to receive emails from us and our affiliates. Your information is secure and your privacy is protected.

    You May Also Like

    Stock

    Let me start by reminding everyone that I believe the most important relationship in the stock market is how consumer discretionary stocks (XLY) perform...

    Latest News

    House Republicans are eyeing reforms to federal benefits that would impose work requirements on a wider swath of Americans. Rep. Dusty Johnson, R-S.D., chair...

    Editor's Pick

    Sister Stephanie Schmidt had a hunch about what her fellow nuns would discuss over dinner at their Erie, Pennsylvania, monastery on Wednesday night. The...

    Investing

    Another week, another gold price record. The yellow metal rose to a new high once again on Thursday (February 20), moving past the US$2,950...