


The news cycle is in high gear lately, leading to some extra volatility. Traders reacting to the news are getting whipsawed, while chartists remain focused on what really matters. Price. Price isn’t everything, it’s the only thing. News, rumors, fundamentals, the Fed, government policy and everything else are reflected in price. And, perhaps more importantly, it is easier to follow price than to distill the news.
As chartists, it is not our job to interpret news events or fundamentals. Our job is to set biases aside and focus on price action. We need to answer three questions in a matter-of-fact manner. What is the long-term trend? Is the ETF/stock showing relative strength? Are there any bullish patterns in play? We want to be long when the answer to all three is yes.
TrendInvestorPro specializes in unbiased analysis that focuses exclusively on price action. Each week we define the big trends, identify the leaders and highlight bullish trading setups. We are currently tracking breakouts from mid January (XLI, KRE, ITA) and leadership in several tech-related ETFs (CIBR, IGV, CLOU, AIQ). Click here to take a trial and gain full access.
So what do we do with the news? Ed Seykota, a legendary trend-follower, advocated a systematic approach to trading. His rules-based focused on riding the trend, setting stop-losses and filing the news. This strategy is summed up in his classic Whipsaw Song, which includes the lines:
What do we do when we get a hot news flash?
We stash that flash right in the trash.
Do yourself a favor and stash that flash right in the trash!
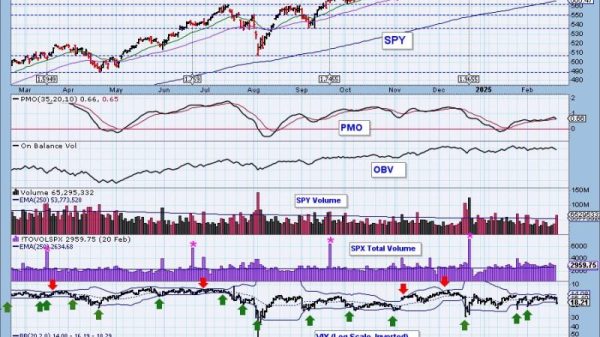
Here is a recent “matter-of-fact” example from our ETF Report. SPY is in a long-term uptrend as a bullish cup-with-handle pattern takes shape. First, SPY is trading near a new high and well above the rising 200-day SMA. Second, the middle window shows the SPY/IWM ratio breaking out in mid December and again in February. This ratio rises when SPY (large-caps) outperforms IWM (small-caps).
SPY is in a long-term uptrend and showing relative strength. This leaves us with the third question. Is there a bullish pattern or trading setup on the price chart? SPY corrected from mid December to mid January and broke out on January 21st. At the time, a falling wedge (pink lines) formed and this bullish breakout featured in our report/video that week. New patterns emerge as bars are added and I now see a cup-with-handle, which is a bullish continuation pattern (blue lines). Rim resistance is set at 610 and a breakout here would confirm the pattern.
For subscribers to TrendInvestorPro, this report continues with a video covering the cup-with-handle pattern in detail. We discuss the rationale behind the pattern, a confirmation level, the price target and the re-evaluation level. Click here to take a trial and gain full access.
///////////////////////