Title: “Enhance Your Stock Market Analysis with These Five Essential Tools”
Introduction:
In the world of stocks and investing, having the right tools at your disposal can make all the difference in making informed decisions and maximizing your returns. With the plethora of information available, it can be overwhelming to sift through data and make sense of stock charts. To simplify this process, we delve into five essential tools that play a crucial role in analyzing stock charts and guiding investment strategies.
1. Candlestick Charts:
Candlestick charts are a popular tool used by traders to visualize price movements over a specified period. Each candle on the chart represents the open, high, low, and close prices for a particular time frame. By analyzing these patterns, investors can gain insights into market sentiment and potential price trends. Understanding candlestick patterns such as doji, hammer, and engulfing can help traders make more informed decisions based on historical price movements.
2. Moving Averages:
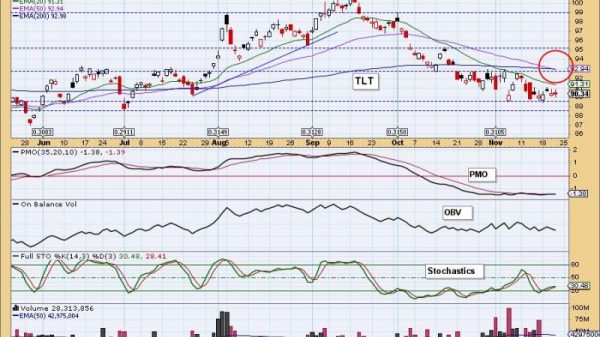
Moving averages are fundamental indicators that smooth out price fluctuations to identify trends. Common types include simple moving averages (SMA) and exponential moving averages (EMA). Traders use moving averages to determine support and resistance levels, spot trend reversals, and generate buy or sell signals. By overlaying different moving averages on stock charts, investors can assess the strength and direction of trends, helping them make timely trading decisions.
3. Relative Strength Index (RSI):
The Relative Strength Index is a momentum oscillator that measures the speed and change of price movements. RSI values range from 0 to 100 and can indicate overbought or oversold conditions in a stock. By identifying these extremes, traders can anticipate potential reversals in price direction and adjust their trading strategies accordingly. Integrating RSI into stock chart analysis enhances the ability to time entries and exits more effectively.
4. Volume Analysis:
Volume is a critical component of analyzing stock charts as it provides insights into the intensity of market participation. By examining volume bars alongside price movements, traders can confirm the validity of price trends. An increase in volume accompanying a price change signifies strong market conviction, while low volume may indicate a lack of interest or liquidity. By incorporating volume analysis into stock chart studies, investors can assess the sustainability of price movements and make informed trading decisions.
5. Fibonacci Retracement Levels:
Fibonacci retracement levels are based on the mathematical sequence discovered by Leonardo Fibonacci and are used to identify potential support and resistance levels in stock charts. By applying Fibonacci retracement tools to significant price swings, traders can anticipate potential reversal zones where price corrections may occur. These levels can assist in setting price targets, stop-loss orders, and determining optimal entry points based on the likelihood of price retracements.
Conclusion:
Navigating the complexities of stock chart analysis requires a combination of technical tools and strategic insights. By leveraging the five essential tools outlined above – candlestick charts, moving averages, RSI, volume analysis, and Fibonacci retracement levels – investors can enhance their ability to interpret market trends,


