Connect with us

Hi, what are you looking for?

Stock

How to Use Fibonacci Retracements to Spot Key Levels

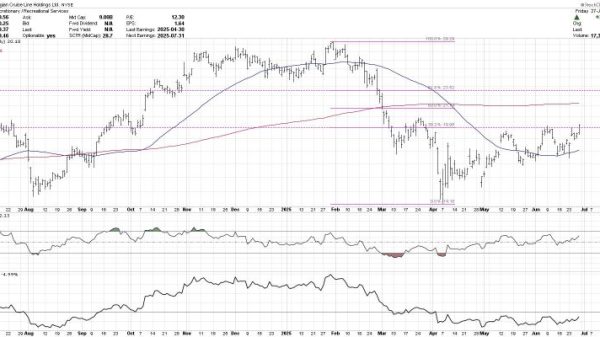
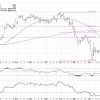
Join Dave as he shares how he uses the power of Fibonacci retracements to anticipate potential turning points. He takes viewers through the process of determining what price levels to use to set up a Fibonacci framework, and, from there, explains what Fibonacci retracements are telling him about the charts of NCLH, RTX, and the S&P 500

This video originally premiered on June 24, 2025. Watch on StockCharts’ dedicated David Keller page!

Previously recorded videos from Dave are available at this link.

    Join our mailing list to get access to special deals, promotions, and insider information. Your exclusive benefits await! Enjoy personalized recommendations, first dibs on sales, and members-only content that makes you feel like a true VIP. Sign up now and start saving!


    By opting in you agree to receive emails from us and our affiliates. Your information is secure and your privacy is protected.

    You May Also Like

    Editor's Pick

    Sister Stephanie Schmidt had a hunch about what her fellow nuns would discuss over dinner at their Erie, Pennsylvania, monastery on Wednesday night. The...

    Stock

    This week, Julius breaks down the current sector rotation using his signature Relative Rotation Graphs, with XLK vaulting into the leading quadrant while utilities...

    Stock

    If you’ve looked at enough charts over time, you start to recognize classic patterns that often appear. From head-and-shoulders tops to cup-and-handle patterns, they...

    Stock

    The stock market has been on quite the rollercoaster of late, thanks to news headlines. But investors seem to have shrugged off the past...